Syslogger
VisitA Docker Compose configuration for collecting syslog messages through Vector, persisting them in Loki, and visualizing via Grafana. I built this to monitor and analyze logs from my home router.
Architecture
Vector
Receives syslog messages via UDP, parses them, and forwards to both console (for debugging) and Loki for storage.
Loki
Log serves as the storage layer. It is optimized for storing and querying log data efficiently.
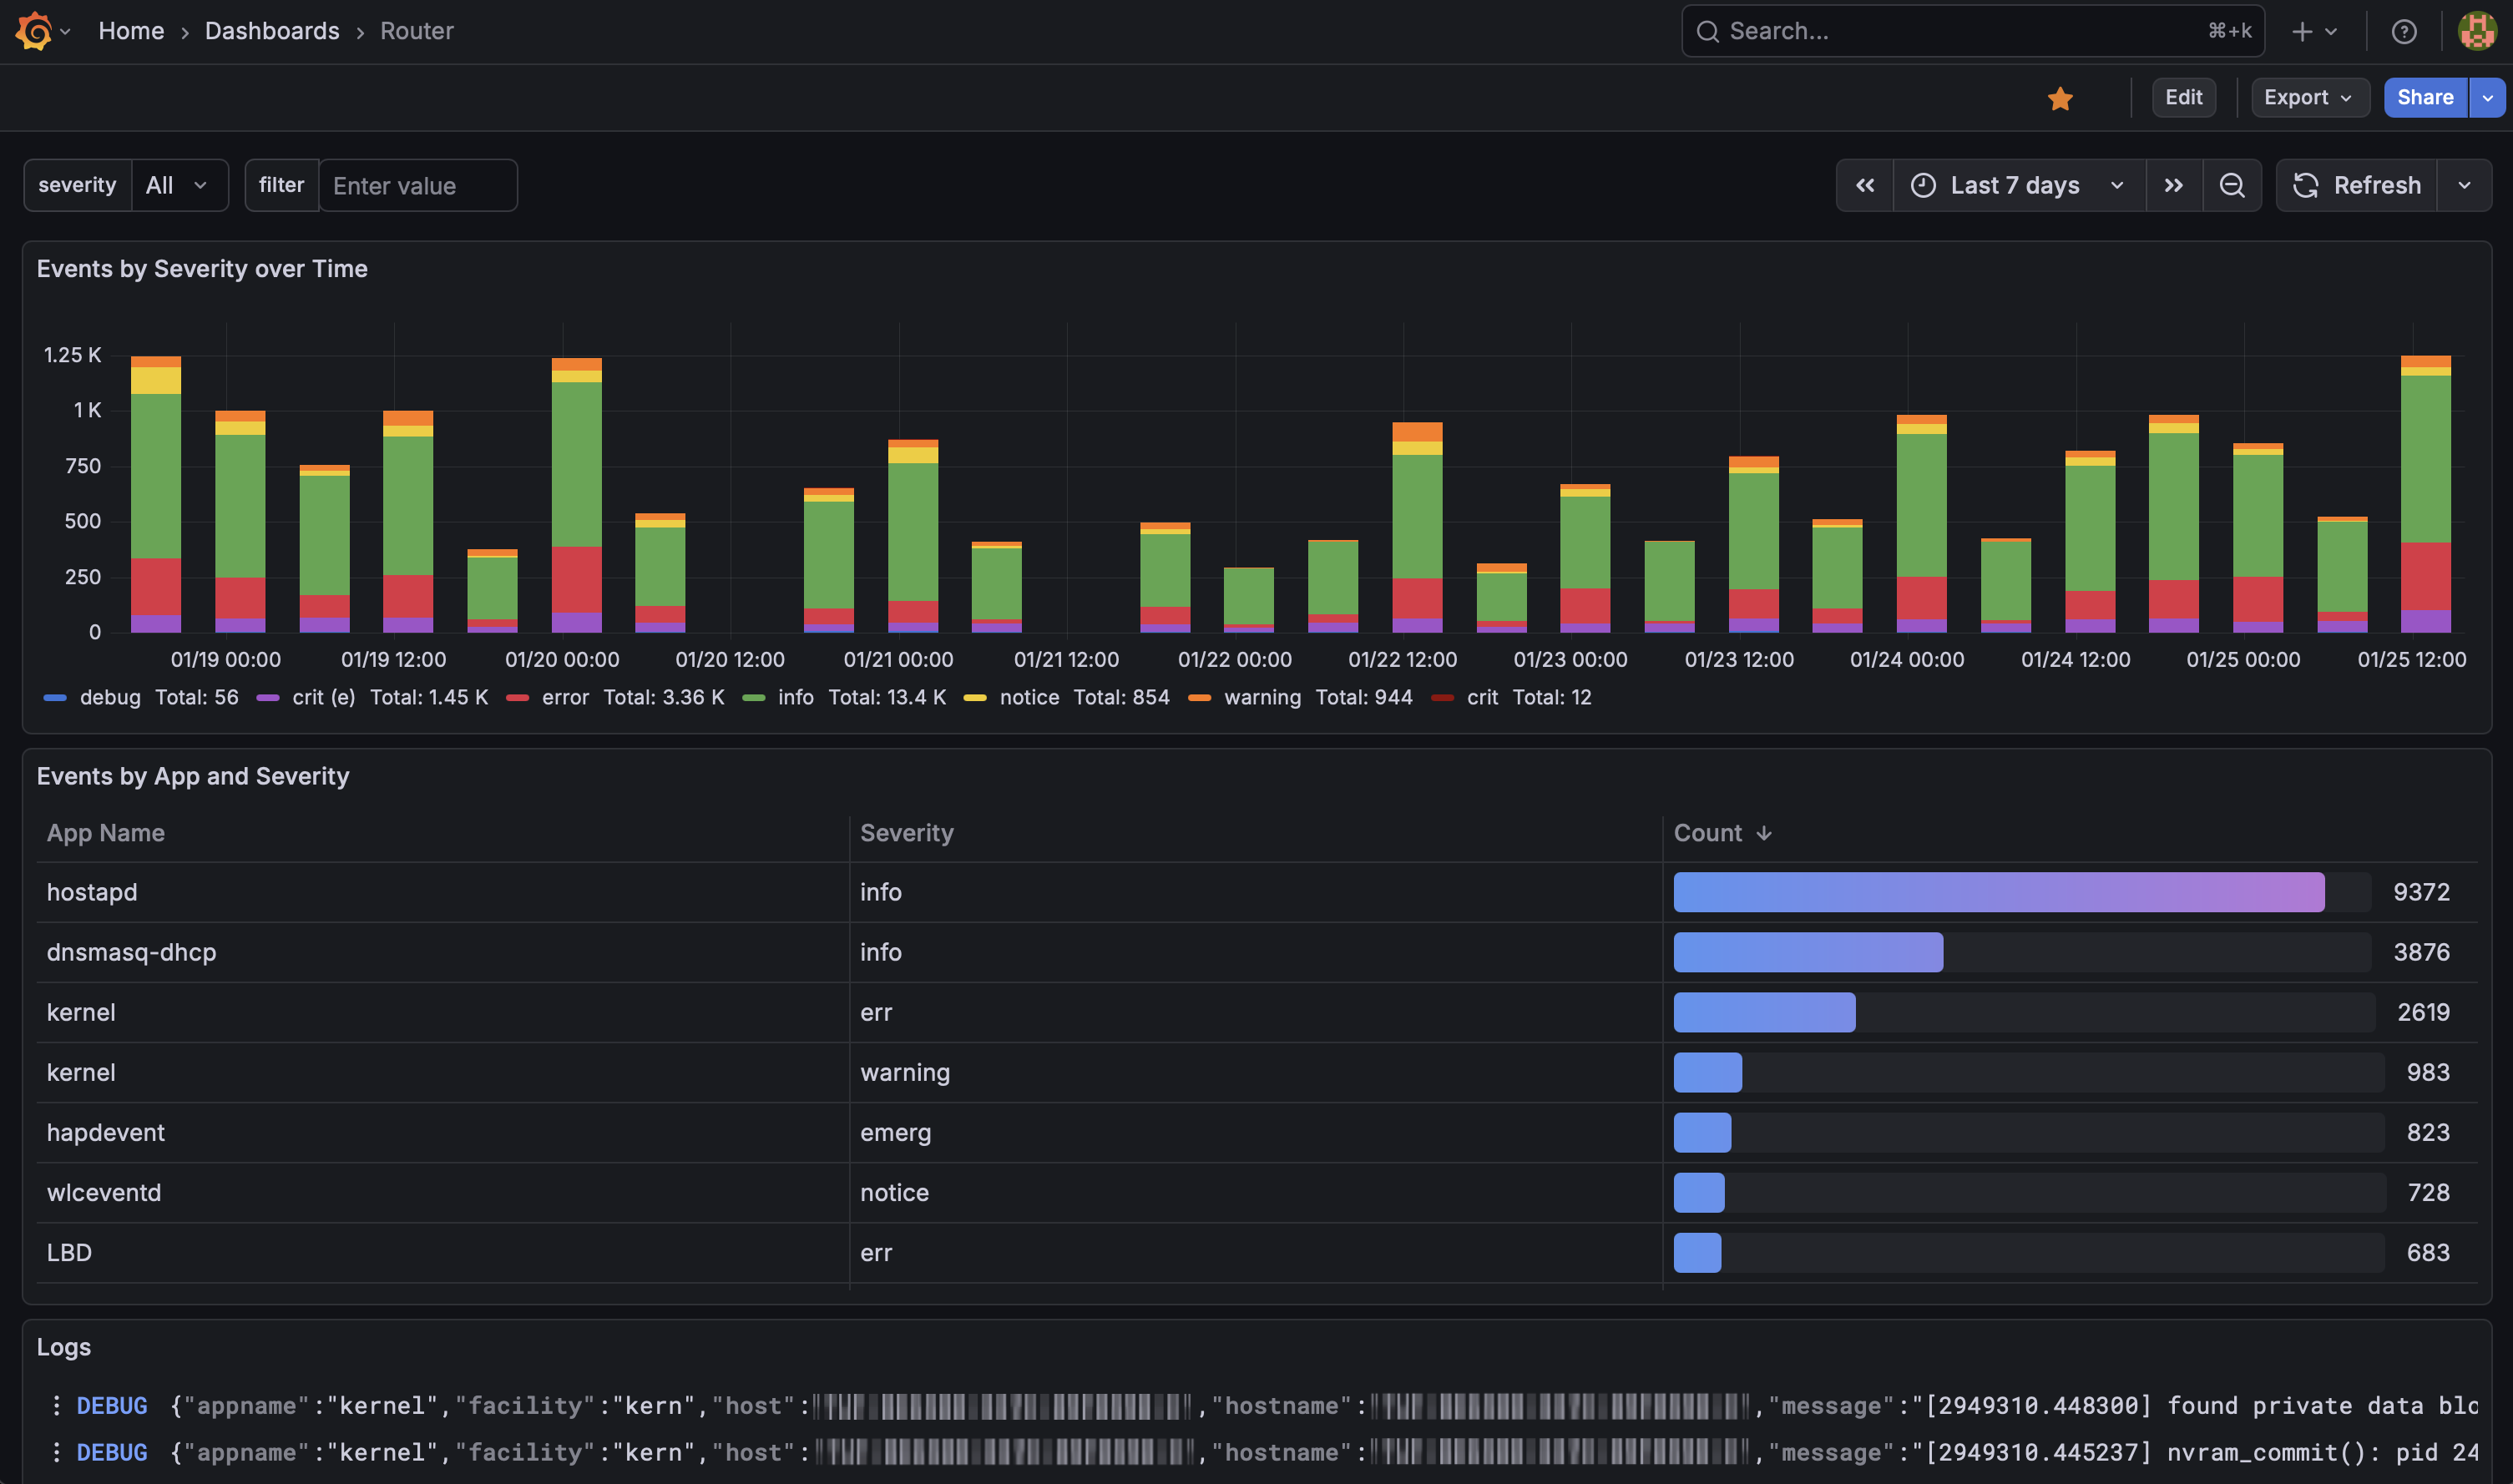
Grafana
Provides the visualization interface with a dashboard template for analyzing log patterns and troubleshooting.
Deployment
The stack can be launched with a single command and is compatible with Raspberry Pi for a low-power homelab setup.